- KNN
- Classifier
- KNN stands for K nearest neighborhood, where K here is the number of neighbor of an arbitrary data point.
-
Consider a model with data located in various labelled groups. When we add a new data point, it will consider what is the nearest distance from this data point to another. With that being said, new data will be classified intuitively.
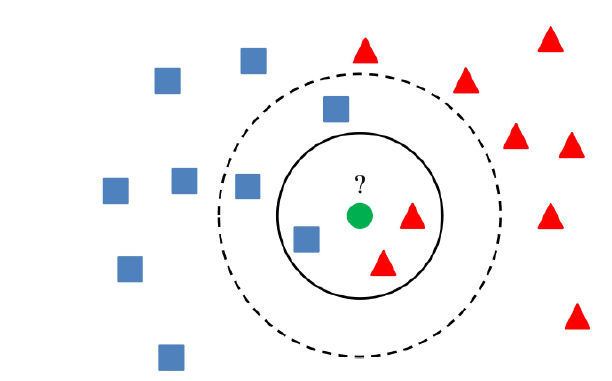
- In the picture, the circle represents for the finite number of data points that are around the new input one (green circle), which means, in that circle, we can count the number of data point and consider which group the green should belong by calculating distance from green circle to other data point.
- The algorithm:
- Firstly, labelled the datasets completely, because it is a supervised learning, labelling is required.
- Secondly, simply calculate the norm (mostly used: Euclidean Norm) between the green dot and other data points, in this case, usually means that we have to calculate all the distance (norm) between green one and the rest.
- Then, each distance, we put into a 2D array (or we can use hash table to store distance data). In the hash table (or 2D array), two categories: the name of label and the value of distance.
- Sort the array / dictionary, according to value of distance (from lowest to biggest).
- Take K elements in that array / dictionary (K neighbors) with smallest distance (in sorted array, it is in the index [0] or maybe index [1] sometimes)
-
Then, compare the occurrence of each element in the same group.
Example: In the picture, we can see that, occurrence of red group is more than blue group —> the green is belong to red group.
-
Euclidean:
def Euclidean_Distance(X, y): norm_of_x = np.sum(X*X, 1) norm_of_y = np.sum(y*y, 1) return norm_of_x.reshape(-1, 1) + norm_of_y.reshape(1, -1) - 2*X.dot(y.T) -
Using Sklearn because of the simplicity of the algorithm:
def main(): model = KNeighborsClassifier(n_neighbors = 10, p = 2, weights = myweight) # myweight is a function we define to upgrade the algorithm # according to the formula below. model.fit(X_train, y_train) y_hat = model.predict(X_test) print ("Print results for 20 test data points:") print ("Predicted labels: ", y_hat[20:40]) print ("Ground truth : ", y_test[20:40]) # print accuracy print ("Accuracy of 1NN: %.2f %%" %(100*accuracy_score(y_test, y_hat))) - Upgrade for this algorithm:
- Increase K: we all know that sometimes, for example, in the picture, the red group is more than blue one, however, there exists possibility that the green one can belong to the blue one —> We can set for higher number of K, in the picture, K = 3, depend on the problems, we sometimes can take K = 10 for sure, in that case the original dataset must be big enough —> This is called “Mayor Voting”.
-
Setting weight: for each data point in our circumstance (in the circle), we set the weight for them, based on their distance. Clearly, the nearer data points are, the bigger their weights are.
Moreover, there are some other ways to set the weights. We can set it uniform (all the data points have same weight —> normal), or we can create a function for distance as input, which is bigger if the input (distance) is large and vice versa.
Luckily, we have one sample:
\[w_i = exp\space(\frac{-\|x - x_i \|^2_2}{\sigma ^2})\]- x is the input (test) data, x_i is point nearby (in the circle of K neighbors), sigma is a positive number. The function is satisfied because the nearer the data points are, the bigger their weight are (the biggest weight is 1, clearly)
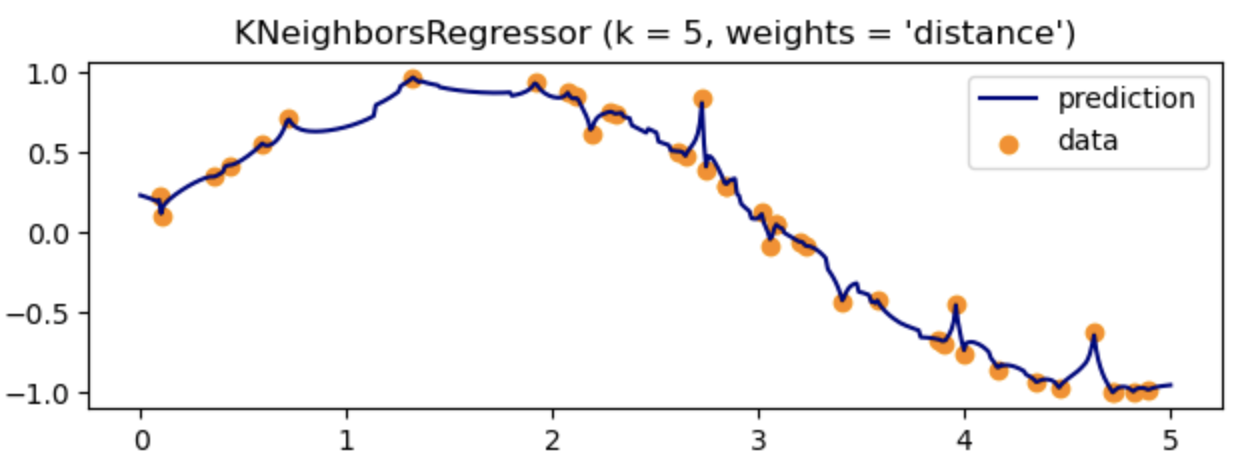
- Regression
- Regression in KNN is not a big deal. Based on the similar method of calculating distance in K neighborhoods, we can approximate the output function which fits the data well.
-
However, in my opinion, it may usually cause overfitting with complex function or just simply huge dataset.
- Discussion
- Disadvantage:
- Sensitive with noise.
- If the dataset is not only huge but also multidimensional, using brute force to find distance between input data with others will take like forever 😂
- Store the distance data in our memory (using hash table or 2D array) is not a good way, because the resource is limited.
- To upgrade:
- Instead of Brute Force, can use some algorithms like KD Tree.
- Normalize the dataset before implementing the algorithm.
- Disadvantage:
- Classifier
- K-Means
- Overview
- Different from KNN, K means clustering is a kind of unsupervised learning, which means that the original dataset is unlabeled.
- The goal of this algorithm is to divide data into different clusters based on their characteristics.
- In detail, each cluster contains a center point, which is very essential to define border between every cluster.
- For the general process:
- Firstly, identify K initial center points arbitrarily, without replacement. Each initial point is the center of each cluster (K points ↔ K clusters).
-
Secondly, calculating Euclidean norm (use Euclidean for convenience) to find distance from the center to the datapoint. The result will be an array (elements are distance), with dimension ≥ 1, so we assign that point which have smallest distance (from center) to the corresponding cluster.
** Here is the instruction for the argmin function in Numpy.
Example:
array = [ [ 1, 2, 4, 7 ], # line 0 [ 9, 88, 6, 45 ], # line 1 [ 9, 76, 3, 4 ] ] # line 2 Each row corresponds for distances from centers to datapoints We have 3 center points here -> 3 clusters For row 1 (center 1): the smallest distance value is 1 in array[0] --> this point in the position [0] will go into cluster 1. For row 2 (center 2): the smallest distance value is 6 in array[2] --> this point in the position [2] will go into cluster 2. For row 3 (center 3): the smallest distance value is 3 in array[2] --> this point in the position [2] will go into cluster 3. -
Thirdly, update center for each cluster by taking the average of all data points in each cluster.
In other word, new center of a specific cluster = sum of all data points in that cluster / number of data points in that cluster
—> new_center_of_cluster_k = average(X_k) (X is data point with corresponding cluster)
- Finally, check whether the algorithm converged or not. By witnessing the change in set of centers. If it is the same as the precious loop —> stop the algorithms, otherwise, continue by repeating the step 2.
- Math
- For this K means stuff, it is strange that understanding the algorithm will lead to understand the math behind better (I think).
- Notation:
- Consider N data points, they are $X = [x_1, \space x_2,\space x_3,…,\space x_N] \in \R^{d \times N}$
- Let K < N be number of clusters that we want to separate.
- For each data point x, exist a corresponding value y, such that y is the label vector of that data point x. $Y = [y_{i1},\space y_{i2}, \space y_{i3},…,\space y_{ik}]$ —> what we need is to find a label $y_i = k$ of each data point $x_i$.
- Here we consider the label vector: $y_i \in \R^{1 \times K}, \space \forall y_i=0, \exist y_k = 1$ (for all y at position i = 0, except y at position k = 1) → this is so-called one-hot coding.
- We also have set of center points updated constantly: $M = [m_1, \space m_2, \space m_3,…,\space m_K]$.
-
Using one-hot coding for representing Y. If $x_i$ is assigned to cluster k —> $y_{ik} = 1, \space y_{ij} = 0 \space \forall j \neq k$, which means there is only 1 element in Y == 1, and the rest will be zeros.
For example:
  if x_i has label: [1, 0, 0, 0,...., 0], it belongs to cluster 1.
  if x_i has label: [0, 1, 0, 0,...., 0], it belongs to cluster 2.
  if x_i has label: [0, 0, 1, 0,...., 0], it belongs to cluster 3.
  if x_i has label: [0, 0, 0, 1,...., 0], it belongs to cluster 4.
  ..........
  if x_i has label: [0, 0, 0, 0,...., 1], it belongs to cluster K.
Generally, constraint for y is
\[y_{ij} \in \{0,\space 1\} \space \forall i, j; \space \sum^K_{j=1} y_{ij} = 1, \space \forall i\] - Goal: find final center points: m1, m2, …..mK and also find label for each data points (each data point must belong to 1 of K clusters).
- Loss Function:
-
Firstly, easily, error is the distance from the center point of a specific cluster k to other points in the data —> using Euclidean norm, obtain:
\[L(m) = \|x_i - m_k\|^2_2\] - Secondly, to decide a data point x belongs to which cluster, we calculate the minimum distance from each center of each cluster and just take the point of smallest distance (like in step 2 & 3 of the general process).
- Therefore, we have K clusters (each corresponding to m center points), with label vector for cluster is Y, we can obtain:
-
For 1 data point with one center for cluster:
\[L(y, m) = y_{ik}\|x_i - m_k\|^2_2\] - For 1 data point x with K centers for K clusters:
-
In general, for N data point with K centers for K clusters:
\[L(Y, M) = \sum^N_{i=1}\sum^K_{j=1} y_{ij}\| x_i - m_j\|^2_2\]This means for each of N data points, we have to calculate K times for K centers corresponding to K clusters. Clearly, what we have to calculate is the distance from each of N data point to K centers (from one point x to many center points - each loop).
$Y = [y_1, y_2,…,y_n]$ and $M = [m_1, m_2, m_3,…, m_K]$ are matrices generated by label vectors of each datapoint and centers of each clusters.
-
Finally, we combine the constraints for representing Y and the Loss function, obtain the general form for optimizing:
\[Y, M = argmin \sum^N_{i=1}\sum^K_{j=1} y_{ij}\| x_i - m_j\|^2_2 \\ subject\space to: \space y_{ij} \in \{0,\space 1\} \space \forall i, j; \space \sum^K_{j=1} y_{ij} = 1, \space \forall i\]
-
- Solving problem:
- It is hard to find the global minimum, however, we can witness something to find a way to get the local minimum. Although it is not a perfect min value, we can use it in this problem to approximate a good result.
-
So, we consider 2 cases:
Case 1: Assume that we found the value for center points, now just need to find the appropriate cluster for x.
-
As I mentioned above, for a data point, it is necessary to calculate the distance from it to each centers (1 to many) ⇒ at a center point: we obtain:
\[y_i = \arg\min_{y_i} \sum^K_{j=1}y_{ij}\|x_i - m_j\|^2_2 \\ subject\space to: \space y_{ij} \in \{0,\space 1\} \space \forall i, j; \space \sum^K_{j=1} y_{ij} = 1, \space \forall i\] -
If we directly multiply the value of y to the distance, because y is only 1 or 0 ⇒ at a cluster: we can obtain:
\[j= \arg \min_j \|x_i−m_j\|^2_2\]It is clear that the min value of j is the smallest distance from center point to x (which can be 0 when $x \equiv m$).
—> For this proof, we know that x will belong to a cluster to which there is a closest distance from the center.
Case 2: Assume that we found the cluster for x, then we must find the new center point for each cluster so that the loss is minimum (according to step 3 in the general process).
- Because we have found the appropriate cluster corresponding to x so far, to find the new center, we need to consider the current number of data point in that cluster.
-
For a cluster, consider all datapoint x, we obtain:
\[m_j = \arg\min_{m_j} \sum^N_{i=1}y_{ij}\|x_i - m_j\|^2_2\]Note that: because of the constraints of y, the formula: $\sum^n_{i=1}y_{ij}$ is number of data point in a specific cluster (may be 1, 2, 3,….,K).
- Luckily, that formula is differentiable at every point —> we can take the derivativ
-
Let derivative = 0
\[m_j\cdot \sum^N_{i=1}y_{ij} = \sum^N_{i=1}y_{ij}x_i \Rightarrow m_j = \frac{\sum^N_{i=1}y_{ij}x_i}{\sum^N_{i=1}y_{ij}}\]Because y is only 0 or 1, for N points, assume x is in cluster 1, y will be [1, 0, 0 , 0,…], and for any of x belongs to cluster 1, we have total value of y for N data points = number of points in a cluster (1, 2, 3….K) → obtain:
- $\sum^n_{i=1}y_{ij}$ is number of points in a specific cluster.
- $\sum^N_{i=1}y_{ij}x_i$ is sum of all points in a specific cluster.
-
With that proof, we know that, the new center will be the average of all data in a specific cluster (which can result in balance number for each cluster).
-
- Stopping Criteria
- The solution is so clear now, what is need is a naive approach, set random centers, calculate distance from each points to K centers and get new centers afterward. Do it iteratively gives us no better than a “While” loop. However, question is when it will stop???
- We have to notice here, the algorithm must be stopped after a finite loop, because loss function must be ≥ 0 (0 means all the datapoint are the center points)
- Because the loss will be reduced constantly after a loop (when implementing step 2 and 3), if the sequence is decreasing and it must greater than or equal to 0, then it will converged → when the center point is the same as the previous loop → stop the algorithm.
- In fact, if N data points are distinct (no same value), it will run N times, but if it has a lot of same points, as far as I know, algorithm may stop earlier (not often).
- Application
- Code
- From the math, we obtain 3 main functions for the K Mean model:
- Firstly, init K means randomly:
- Secondly, update distance (decide x belong to which cluster).
- Finally, update center point after deciding.
- Besides, we need a function to stop the loop.
def kmeans_display(X, label): K = np.amax(label) + 1 X0 = X[label == 0, :] X1 = X[label == 1, :] X2 = X[label == 2, :] plt.plot(X0[:, 0], X0[:, 1], 'b^', markersize = 4, alpha = .8) plt.plot(X1[:, 0], X1[:, 1], 'go', markersize = 4, alpha = .8) plt.plot(X2[:, 0], X2[:, 1], 'rs', markersize = 4, alpha = .8) plt.axis('equal') plt.plot() plt.show() def Euclidean_Distance(X, y): norm_x = np.sum(X*X, 1) norm_y = np.sum(y*y, 1) return norm_x.reshape(-1, 1) + norm_y.reshape(1, -1) - 2*X.dot(y.T) def init_centerpoint(X, k): n_features = len(X) # randomly pick k rows of X as initial centers return X[np.random.choice(n_features, k, replace=False)] def assign_labels(X, centers): distance = Euclidean_Distance(X, centers) # return index of the closest center return np.argmin(distance, axis = 1) def update_centers(X, labels, K): centers = np.zeros((K, X.shape[1])) for k in range(K): # collect all points assigned to the k-th cluster Xk = X[labels == k, :] # take average centers[k,:] = np.mean(Xk, axis = 0) return centers def check_converged(centers, new_centers): # return True if two sets of centers are the same return (set([tuple(a) for a in centers]) == set([tuple(a) for a in new_centers])) def kmeans(X, K): centers = [init_centerpoint(X, K)] labels = [] iter = 0 while True: labels.append(assign_labels(X, centers[-1])) new_centers = update_centers(X, labels[-1], K) if check_converged(centers[-1], new_centers): break centers.append(new_centers) iter += 1 return (centers[-1], labels, iter) - From the math, we obtain 3 main functions for the K Mean model:
- Clustering for MNIST dataset (can use KNN too).
- Image Compression.
- Object Segmentation.
- Recommendation system.
- Code
- Discussion
- Disadvantage:
- Biggest barrier is we have to know (estimate) how many clusters are necessary.
- Depend on the initial centers, we can have good / bad performance
- Number of data point in each cluster must be balanced (nearly equivalent).
- Can not output the correct cluster if:
- Cluster is not totally circle.
- Cluster is in another cluster.
- Disadvantage:
- Overview
-
Reference
K-Means
English
- https://www.sciencedirect.com/science/article/abs/pii/S0167865504000996
- https://www.simplilearn.com/tutorials/machine-learning-tutorial/k-means-clustering-algorithm
- https://en.wikipedia.org/wiki/K-means_clustering
Vietnamese:
KNN
English:
- http://machinelearningmastery.com/tutorial-to-implement-k-nearest-neighbors-in-python-from-scratch/
- https://en.wikipedia.org/wiki/K-nearest_neighbors_algorithm
- https://codelearn.io/sharing/thuat-toan-k-nearest-neighbors-knn
Vietnamese
Blog and stuffs